Illuminance Contribution
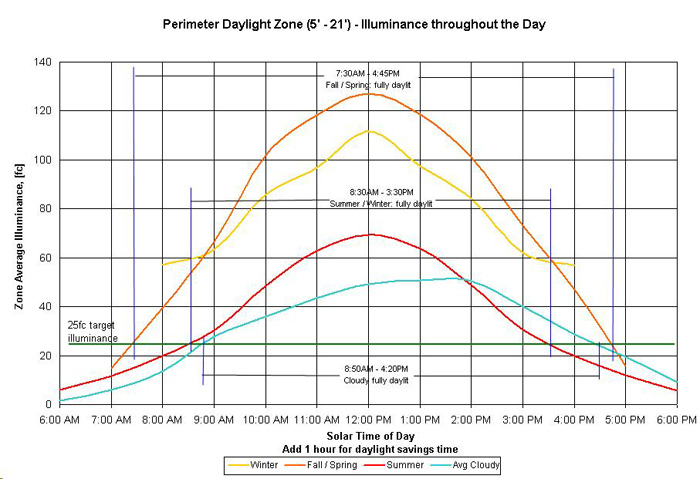
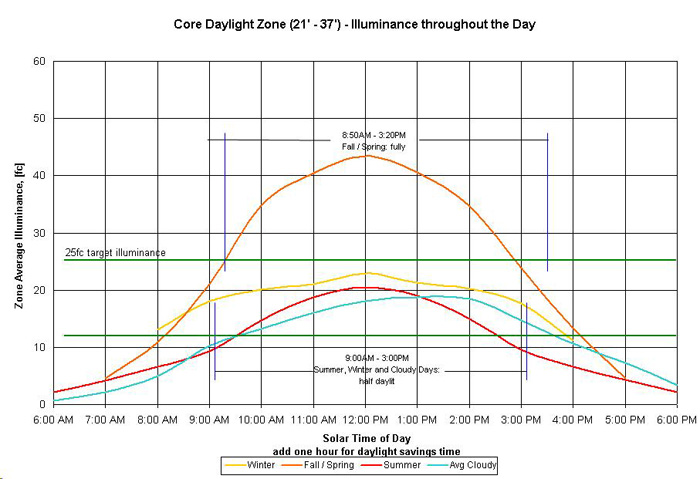
Plots of illuminance versus time of day answer the question, “How much light does the LightLouver Daylighting System provide on a work surface?” The three figures below display the average illuminance, in foot candles (fc) versus time of day, that the LightLouver Daylighting System will provide to a typical south-facing daylit space located at 40o latitude. Each figure has four plots. Three of them show the illuminance at the winter solstice, summer solstice, and the equinox (which occurs in Spring and Fall). Each figure also has a fourth plot which shows the average illuminance on a cloudy day. The first figure shows these values as an average over the entire 30-foot depth of the space. Since the illuminance decreases the farther away a work surface is from the daylight aperture, designers will want more detail than just the average over the daylit space. Two figures are provided that divide the daylit space into two zones. One shows the average illuminance over the perimeter 15 foot daylight zone and the other shows the average illuminanceover the core 15 foot daylight zone. In this scenario, a 5’ perimeter walkway exists so the daylight zones start 5’ from the window wall.
The information in these figures plus long-term climate statistics pertaining to cloud cover for a specific location can be used to predict illuminance for that location. For instance, if a location is 30% cloudy at noon in the fall, the average illuminance that can be expected from the LightLouver Daylighting System at that hour is (0.7 x sunny illuminance + 0.3 x cloudy illuminance) = 63 fc.
.jpg)
To download a PDF of the information presented above, please click the following link: